Executive Summary
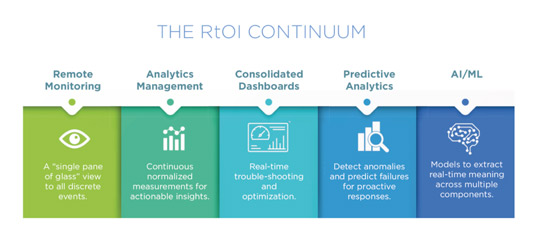
The Real-time Operational Intelligence (RtOI) Continuum is a five-phase framework for leveraging infrastructure data to improve business decision-making. It progresses from basic alarm monitoring through analytics, consolidated dashboards, and predictive analytics to full AI/Machine Learning. Each phase delivers measurable ROI, and each builds on a normalized, enterprise-wide data foundation. Organizations that skip Phase 1 cannot reliably reach Phases 4 or 5.
What Is Real-time Operational Intelligence?
Real-time Operational Intelligence (RtOI) is the practice of continuously collecting, normalizing, and analyzing infrastructure data across an enterprise to enable faster, better-informed operational decisions. Unlike point-in-time reporting, RtOI surfaces live insights from servers, clouds, remote sites, and edge devices—all from a single pane of glass.
“How can I manage my infrastructure?” is one of the most common questions heard across the C-Suite, business unit managers, and the people who monitor systems. Servers, clouds, remote boxes, and mobile devices are complicated enough on their own. Mix in a wide range of disparate legacy software and the challenge becomes significant.
Today AI is frequently presented as a universal solution. The reality is more nuanced: you don’t flip a switch to turn AI on in your organization. Leveraging the value of your data is not a binary decision—it is a process. The RtOI Continuum is that process.
The 5 Phases of the RtOI Continuum
The RtOI Continuum employs data, reporting, analytics, and AI to improve business decision-making. There is significant ROI attached to each of the five stages, so it pays for organizations to embark on the path early. But it only works if you get Phase 1 right.
Phase 1: Alarm Monitoring
The first step to getting value out of your data is a normalization of all data types, so you have a unified, enterprise-wide view in real-time. Alarm Monitoring gathers all disparate, unstructured, siloed data—from every remote location—into one source of truth.
- Continuous, live monitoring of all infrastructure assets
- Eliminates siloed, disconnected data sources
- Establishes the normalized data foundation required for all subsequent phases
- Delivers tangible ROI even at this initial level
This is the baseline—watching everything live, continuously, in real-time. Without this foundation, advanced analytics and AI have no reliable data to work with. Learn more about how DCIM software provides this single-pane-of-glass visibility across your infrastructure.
Phase 2: Analytics Management
Once data is normalized, you begin to leverage metrics across the enterprise. Phase 2 incorporates the ability to develop sophisticated analysis of trends, time-aligned and normalized for easy comparison.
- Integrated charts, graphs, and structured reports
- Cross-department and cross-region trend visibility
- Historical data comparison for operational benchmarking
Organized reporting delivers valuable insights across departments, regions, and history—turning raw alarm data into actionable operational intelligence.
Phase 3: Consolidated Dashboards
To make valuable analytics data truly actionable requires a robust, on-demand, personalized user interface. Phase 3 delivers a suite of live dashboards that facilitate real-time troubleshooting and optimization.
- 24/7 availability of analytics outputs
- Deep drill-down into individual edge devices
- Role-based views for operators, managers, and executives
Consolidated dashboards are where insights become operational—turning trend data into decisions that field and NOC teams can act on immediately. The Modius OpenData platform delivers this consolidated dashboard capability alongside full infrastructure monitoring.
Phase 4: Predictive Analytics
With normalized data and established reporting, Phase 4 introduces complex mathematical transformations of all your data regardless of source. This is where anomaly detection and failure prediction become possible.
- Complex mathematical modeling across all data sources
- Anomaly detection before failures occur
- Proactive response to predicted equipment behavior
- Significant additional ROI through reduced unplanned downtime
While advanced analytics rely on Subject Matter Experts to identify and enter initial parameters, predictive analytics begins to let software define the inputs and relationships—a critical bridge toward AI.
Phase 5: AI / Machine Learning
At the final stage, algorithms self-train and self-improve based on learning sets. With AI, this advances to autonomous control of infrastructure systems.
- Self-training algorithms that improve over time
- Autonomous control and optimization
- Highest ROI potential—but only achievable with Phases 1–4 complete
There is enormous promise at Phase 5, but it is critical to do the foundational work of Phases 1–4 first. AI requires a cohesive, clean, normalized data set. Skipping ahead produces unreliable outputs.
Why Legacy Systems Are the Biggest Challenge
The biggest challenge organizations face as they work through the RtOI Continuum is the presence of multiple legacy systems operating across the enterprise. Disparate equipment, firmware versions, and proprietary protocols create fragmentation that blocks data normalization at Phase 1.
This is the Modius advantage. The Modius OpenData platform works from a configuration model that can ingest data from any piece of equipment—any make, any model, any firmware version. Rather than leaving data disparate across your estate, Modius structures the data at the edge and sends only relevant, sanitized information to the central server.
How Modius Addresses Each RtOI Phase
| RtOI Phase | Modius Capability |
|—|—|
| Phase 1: Alarm Monitoring | Universal device ingestion, normalized single pane of glass |
| Phase 2: Analytics Management | Trend analysis, cross-site reporting, historical comparison |
| Phase 3: Consolidated Dashboards | Live dashboards, role-based views, drill-down to edge |
| Phase 4: Predictive Analytics | Anomaly detection, failure prediction, proactive alerting |
| Phase 5: AI / Machine Learning | Self-improving algorithms, autonomous optimization |
The Modius Edge Architecture Advantage
Moving compression and analysis to the edge means only relevant and sanitized data is sent to the central server, reducing bandwidth consumption significantly. Companies with multiple geographically distributed locations see substantial improvements in data processing speed.
With best-in-breed integration, organizations gain a single view from all locations. The Modius model of collecting at the edge also ensures that mediation goes to the central server in a cyber-secure format—so companies can still employ their legacy systems while gaining modern security posture.
Because devices can be instantiated using simple configuration or prefabricated templates, Modius is typically 33–50% less expensive than other providers. See the DCIM Buyer’s Guide for a detailed comparison of what to look for in an operational intelligence platform.
Frequently Asked Questions
What is the Real-time Operational Intelligence (RtOI) Continuum?
Answer: The RtOI Continuum is a five-phase framework that guides organizations from basic infrastructure monitoring to full AI/Machine Learning-driven autonomous control. Each phase—Alarm Monitoring, Analytics Management, Consolidated Dashboards, Predictive Analytics, and AI/ML—builds on a normalized data foundation established in Phase 1 and delivers measurable ROI along the way.
Why can’t an organization skip directly to AI without completing earlier phases?
Answer: AI and Machine Learning algorithms require clean, normalized, enterprise-wide data to produce reliable outputs. Without Phase 1 (Alarm Monitoring) establishing a single source of truth, and Phases 2–3 validating and contextualizing that data, any AI layer will operate on fragmentary or inconsistent inputs—producing unreliable results. The RtOI Continuum is sequential by design.
What ROI can organizations expect at each phase of the RtOI Continuum?
Answer: ROI is present at every phase, not just at the AI stage. Phase 1 delivers immediate value through unified visibility and faster alarm response. Phase 2 enables trend-based cost and efficiency improvements. Phase 3 accelerates decision-making across teams. Phase 4 reduces unplanned downtime through predictive failure detection. Phase 5 enables autonomous optimization that would be impossible to achieve manually.
How does DCIM software support the RtOI Continuum?
Answer: DCIM software provides the foundational data normalization, monitoring, and analytics infrastructure required for every phase of the RtOI Continuum. Platforms like Modius OpenData ingest data from heterogeneous legacy equipment, normalize it into a unified data model, and expose it through dashboards, reports, and predictive tools—enabling organizations to progress through the continuum systematically.
How does Modius handle legacy infrastructure that other platforms can’t connect to?
Answer: Modius uses a configuration model approach that can ingest data from any equipment—regardless of make, model, or firmware version. Rather than requiring equipment replacement, Modius normalizes existing legacy system data at the edge and delivers it to a central server in a structured, cyber-secure format. This is what allows organizations with complex legacy estates to start their RtOI journey at Phase 1 without a forklift upgrade.
Is real-time operational intelligence the same as SCADA or BMS monitoring?
Answer: RtOI encompasses SCADA and BMS monitoring as inputs but goes significantly further. SCADA and BMS systems typically provide siloed, system-specific views. The RtOI Continuum normalizes data from SCADA, BMS, IT systems, and all other infrastructure sources into a unified platform—then adds analytics, dashboards, predictive modeling, and AI layers on top. The goal is enterprise-wide operational intelligence, not system-specific monitoring.