

TL;DR
- Report the kilowatts first. Data center liquid cooling that cuts total power 10% can show a PUE improvement of 3% or less. The energy savings are real; the ratio just can’t display them.
- Server fan power lives inside IT energy. Removing fans shrinks the denominator and cancels most of the facility-side gain.
- Where you power the CDU from decides which side of the formula it lands on. Same watts, two different PUE numbers.
- Cold plates leave 20–30% of rack heat on cool air, so the air plant runs at part load, where energy costs per unit of cooling are highest.
- Publish PUE with its qualifiers, flag the break in your trend line, and track facility kW, IT kW and compute kW separately.
You spent 11 months on the direct-to-chip retrofit. Cold plates on the GPU rows, two CDUs, a new secondary loop, chilled water setpoint raised. Facility power came down — you can see it on the bill. Then the quarterly report lands and PUE went from 1.38 to 1.34, and the exec team asks why a project that size barely moved the ratio.
Nobody misconfigured a meter. PUE reported what it was built to report: a ratio, not savings. Liquid cooling shrinks both halves of that ratio at once, and the metric can’t see it happen.
What is the PUE formula?
Power usage effectiveness (PUE) is total facility energy divided by IT equipment energy. Data center operators have used the PUE calculation since The Green Grid published it in 2007.
PUE = Total facility energy ÷ IT equipment energy
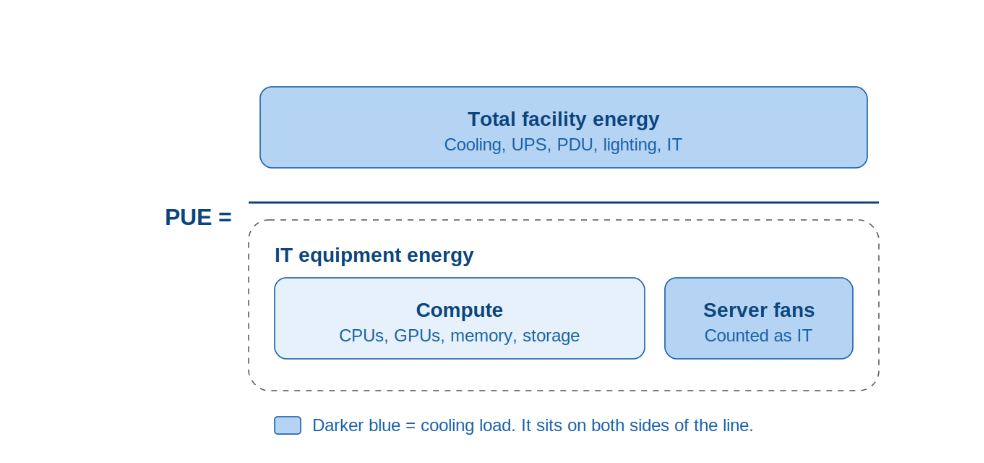
It captures infrastructure efficiency — not total data center energy consumption, and nothing about the efficiency of the computing work.
The 10% you saved and the 3% you can show
Baseline: 1,380 kW total facility power, 1,000 kW IT power. PUE 1.38.
After the retrofit: total power falls 10% to 1,242 kW, while IT power falls 7% to 930 kW as server fan demand declines. PUE 1.34 — a 3% improvement.
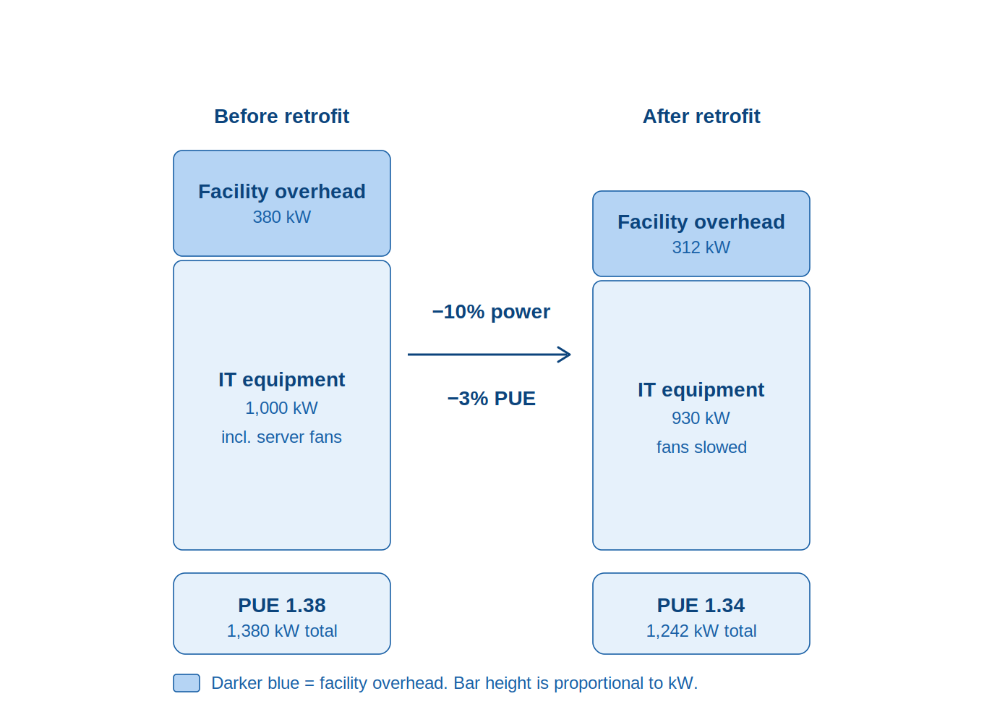
A tenth of total power consumption, gone. The headline metric moved by less than a third of that.
PUE can even stay flat while energy use falls. If facility energy and IT energy decline by the same percentage, the ratio doesn’t move at all — and an operator reading the PUE column could conclude the retrofit bought nothing.
Your IT load has cooling inside it
Server fans are the main reason. Liquid cooling reduces the need for server airflow, so fan power falls alongside facility cooling power — and fan power counts as IT power, which puts it in the denominator, right next to the GPUs. Slowing fans removes cooling load from the facility and shrinks the number PUE divides by.
Had IT power held at 1,000 kW above, the same 1,242 kW total would report 1.24. That gap is an IT-side reduction PUE cannot describe. Not a flaw in your metering — the definition.
The CDU changes sides depending on how it’s powered
PUE was defined in 2007, when the boundary between data center infrastructure and IT was a wall you could touch. Cold plates put infrastructure inside the chassis, and that boundary stopped being physical.
So where the CDU draws its power now decides which side of the ratio it lands on. An in-rack CDU fed from the rack PDU lands inside your IT energy measurement. A floor-standing CDU on facility switchgear lands in the numerator with the chillers. Same pump, same heat.
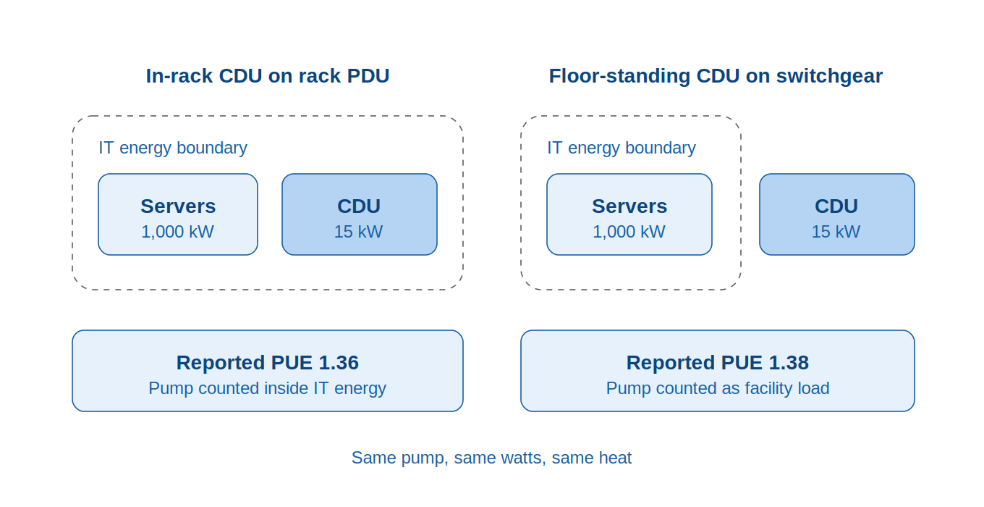
Total is total, so facility energy doesn’t change. The denominator does. Reclassify 15 kW of pump power from facility to IT on a 1,000 kW load at 1.38, and reported PUE drops to 1.36 — two hundredths of efficiency from a decision made by an electrical contractor, and not one watt saved.
If you retrofitted with in-rack CDUs and PUE improved, part of that gain is real cooling. Part is just where the meter sits. You can’t tell which from the ratio alone.
You’re running two cooling systems now, and one is at part load
Cold plates capture most of the rack heat. Memory, storage drives, NICs and voltage regulators still release heat into the cool air moving through the rack — typically 20–30% of rack load. Your CRAHs were sized for 100% of it and now carry a quarter of design load, where chilled water plants and fan systems hit their worst efficiency and their highest energy costs per kW of cooling delivered.
PUE shows you the sum. It doesn’t show you the mechanical plant got less energy efficient while the total got smaller. That distinction matters when you’re comparing cooling strategies and reporting data center energy efficiency.
Three numbers, not one ratio
This is why TUE exists — Total Usage Effectiveness, defined in a 2013 ORNL paper as ITUE × PUE. It replaces IT power with the power reaching compute, counting fans, in-chassis pumps and PSU losses separately.
Track three numbers instead of one ratio: facility kW, IT kW at PDU output, compute kW. PUE is the first over the second. TUE is the first over the third. When they disagree, the disagreement is the story. Real-time collection helps you spot the gap as it opens, even when the reported monthly figure is calculated after the data is aligned.
What to check this week
- List every device whose power source changed. CDUs, in-row units, rear-door heat exchangers, in-rack pumps. Name the meter each sits behind now and the one it sat behind before. That list is where your PUE trend breaks.
- Pull server fan power. Redfish or IPMI exposes it on most current servers. Compare a GPU node before and after cold plates — it’s the largest term in the denominator that isn’t compute.
- Calculate the three numbers for one month. Facility kWh, IT kWh at PDU output, IT kWh minus fans and pumps. The gap between the last two is what PUE has been charging you for.
- Check the part-load point on the air plant. Under 30% of design load, you’re paying capacity penalties on cooling you retired.
How to report PUE after a liquid-cooling retrofit
You still have to publish a number. Tenants ask for PUE in SLAs, the EU regulation asks for PUE, auditors ask for PUE. The fix isn’t to stop reporting it — it’s to stop reporting it alone.
- Lead with the kilowatts. “We cut 138 kW, roughly 10% of site load” is the result. The ratio is context, not headline. Put the annual energy costs avoided next to it and the efficiency gains stop being abstract.
- Publish PUE with its qualifiers. “1.34 at Category 2, 71% liquid capture, annualized” is a number a tenant or auditor can evaluate. “1.34” is a number they have to take on trust.
- Flag the discontinuity. Your pre-retrofit and post-retrofit PUE aren’t measured against the same boundary. Name the devices that moved and the date they moved, or every year-over-year comparison you publish is quietly wrong.
- Show the denominator separately. IT power fell 7% in the example above. That belongs in the report — it’s the term that cancelled your facility-side gain, and it’s invisible in the ratio.
The number is about to become a decision
You’ll report this figure somewhere. In a tenant QBR. Into annual EU data center sustainability reporting, if the site has at least 500 kW of installed IT power demand.[1] On the slide justifying phase two.
Average PUE has sat near 1.54 for six straight years, according to Uptime Institute’s 2025 survey. Rack densities climbed over those years. Cooling architecture changed underneath it. The average didn’t move. That flat line isn’t only about stalled efficiency — it’s partly about a metric that can no longer see what changed.
If PUE can’t distinguish power saved from load shifted across the boundary, it isn’t a reliable basis for a capital decision. Modius OpenData® collects CDU pump power through Modbus, rack PDU load through SNMP and chiller data through BACnet, combining them against your configured measurement boundaries.
See your facility, IT and compute loads as three separate numbers. Book a 30-minute live demo with a technical expert →
What is PUE in a data center, and how do you calculate it?
Data center PUE is total facility energy divided by IT equipment energy over the same period. A PUE of 1.4 means 0.4 kW on cooling, distribution and lighting for every 1 kW of IT load. It measures infrastructure overhead, not compute efficiency, which is why two facilities doing identical work report different numbers.
To calculate PUE, measure both over the same 12-month period, following ISO/IEC 30134-2. Where you measure IT energy also matters:
- Category 1: UPS output
- Category 2: PDU output
- Category 3: Rack or device
The same facility reports a higher data center PUE at Category 3, because more distribution losses fall outside IT energy. Always publish the category.
How should I report PUE after a liquid-cooling retrofit?
Report kilowatts saved first and PUE second, with its measurement category and liquid capture ratio attached. Flag the date your measurement boundary changed so year-over-year comparisons stay honest, and report the IT-side reduction separately — it’s the term that offsets your facility-side gain and it doesn’t appear anywhere in the ratio.
Why doesn’t the vendor’s PUE match mine?
Different boundaries, usually. A vendor modelling a cold-plate deployment may assume a higher liquid capture ratio than your rack actually achieves, count in-rack pumps and heat exchangers on the facility side, or quote at Category 1 while you measure at Category 2. None of that is dishonest — it’s the same ambiguity that lets one CDU produce two PUE numbers. Normalize on capture ratio and measurement category before you compare cooling strategies.
What is a good PUE for a data center?
The average PUE was about 1.54 in Uptime Institute’s 2025 survey. But a good data center PUE depends on how data centers operate at that site: newer facilities in cooler climates run lower, older ones in warmer climates run higher. Rather than benchmarking against another data center, track your own PUE over time — steady improvement is a better sign of data center energy efficiency than an industry average, and a clearer way to show you can improve PUE.
Does liquid cooling lower PUE?
Usually yes, and often by less than the energy you save. Direct-to-chip cooling cuts facility overhead and server fan power at once, and because fan power counts as IT energy, both halves of the PUE ratio shrink together. Read: A Smarter Approach to PUE with DCIM.
Why doesn’t my PUE match my utility bill?
They measure different things. Your utility bill covers all power consumption behind the service entrance — office space, untracked equipment, other loads. Your PUE covers only what’s inside the boundary your team defined, which may be outdated. Method matters too: PUE from monthly totals differs from the average of continuous readings.
Modius OpenData centralizes meter data and applies consistent calculations, surfacing the missing loads and boundary definitions behind a mismatch. Book a live demo.
About Modius
Modius delivers real-time, scalable infrastructure management software purpose-built for critical facilities, from data centers to telecom, smart buildings, and beyond. Our flagship platform, OpenData, unifies operational and IT systems into a single pane of glass, empowering teams with actionable insights across power, cooling, environmental, and IT assets.
By eliminating fragmented tools and enabling predictive analytics, capacity planning, and 3D visualization, Modius helps operators master both white and gray space with confidence.
Trusted by global leaders, our solutions drive uptime, efficiency, and ROI. Don’t just monitor your infrastructure, master it with Modius OpenData, the next-gen DCIM standard for AI workloads.
Sources
[1] European Commission. “Commission Delegated Regulation (EU) 2024/1364,” Official Journal of the European Union, May 17, 2024. https://eur-lex.europa.eu/eli/reg_del/2024/1364/oj
Uptime Institute. 2025 Annual Global Data Center Survey. 2025. https://datacenter.uptimeinstitute.com/rs/711-RIA-145/images/2025.Annual.Survey.Report.pdf